|
|
 |
||||
|
|
|
|
|
|
|
|
This material is based upon work
supported by the National Science Foundation under Grant No. 0082817 |
|||||
 |
|
|
|
|
||||
|
|
|
|
|
|
|
|
This material is based upon work
supported by the National Science Foundation under Grant No. 0082817 |
|||||
|
|
|
|
|
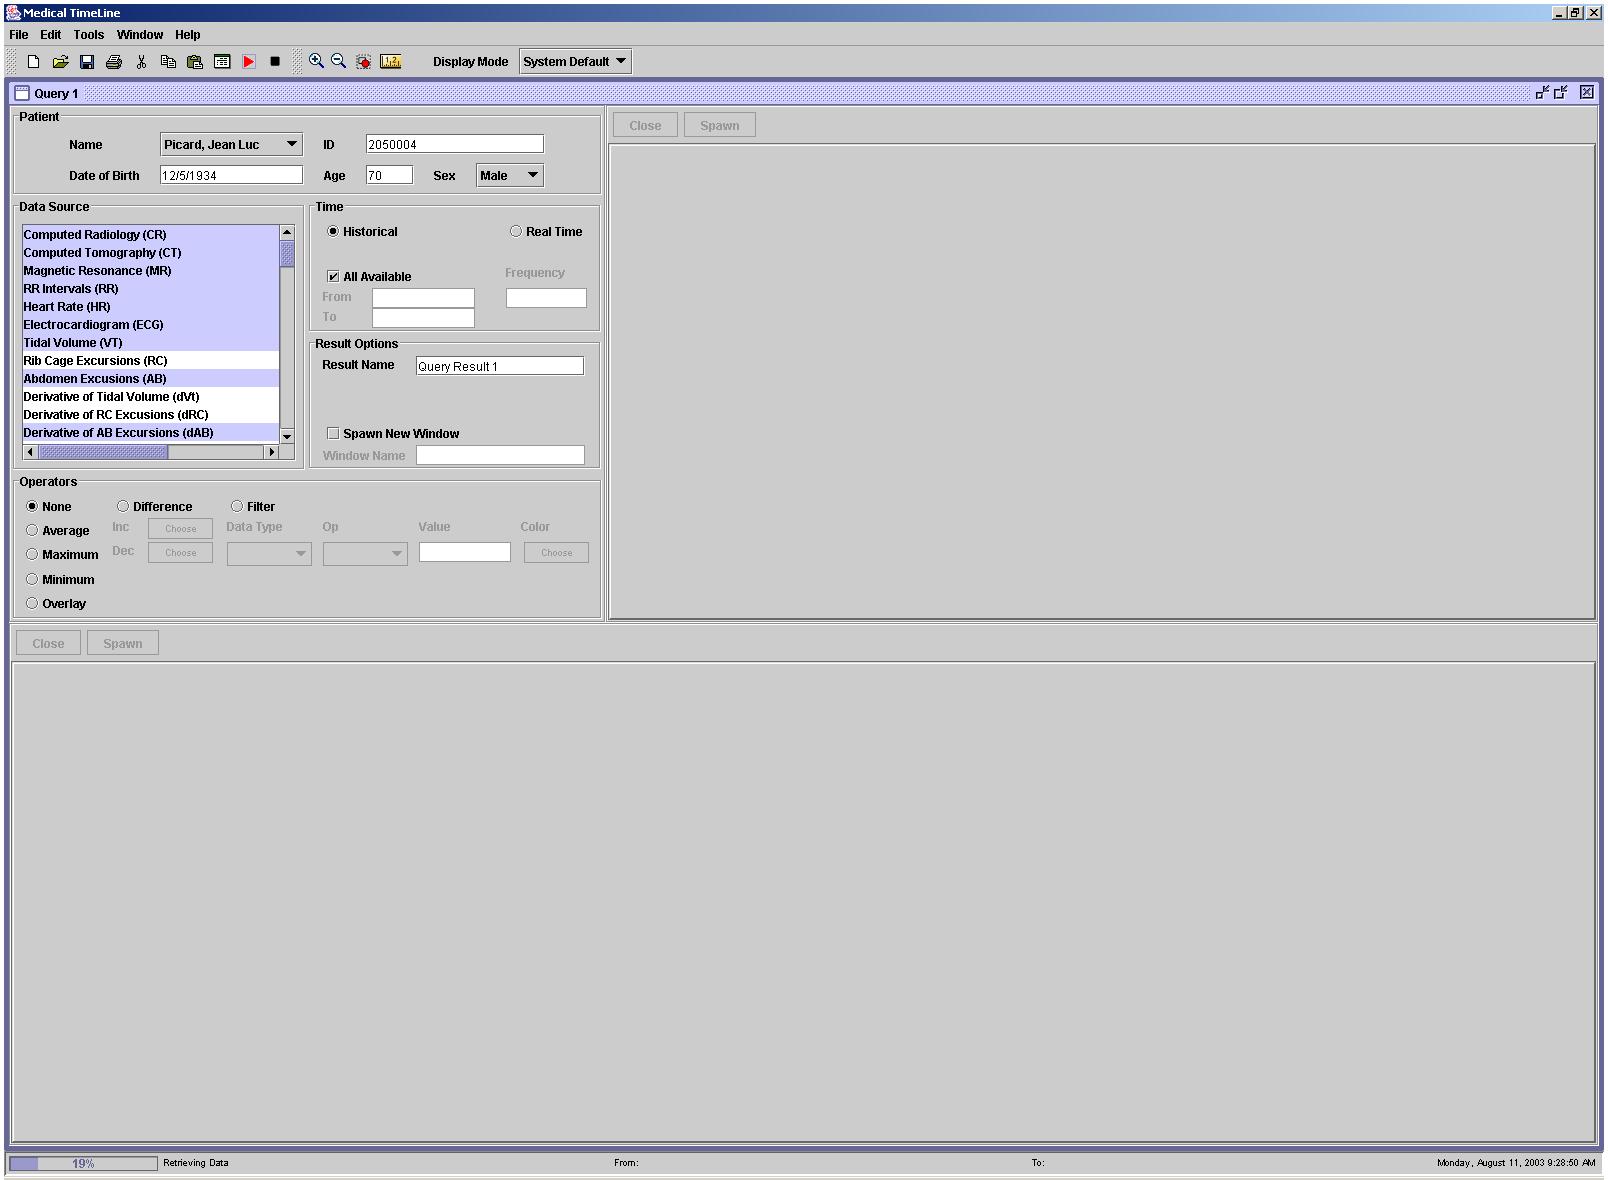
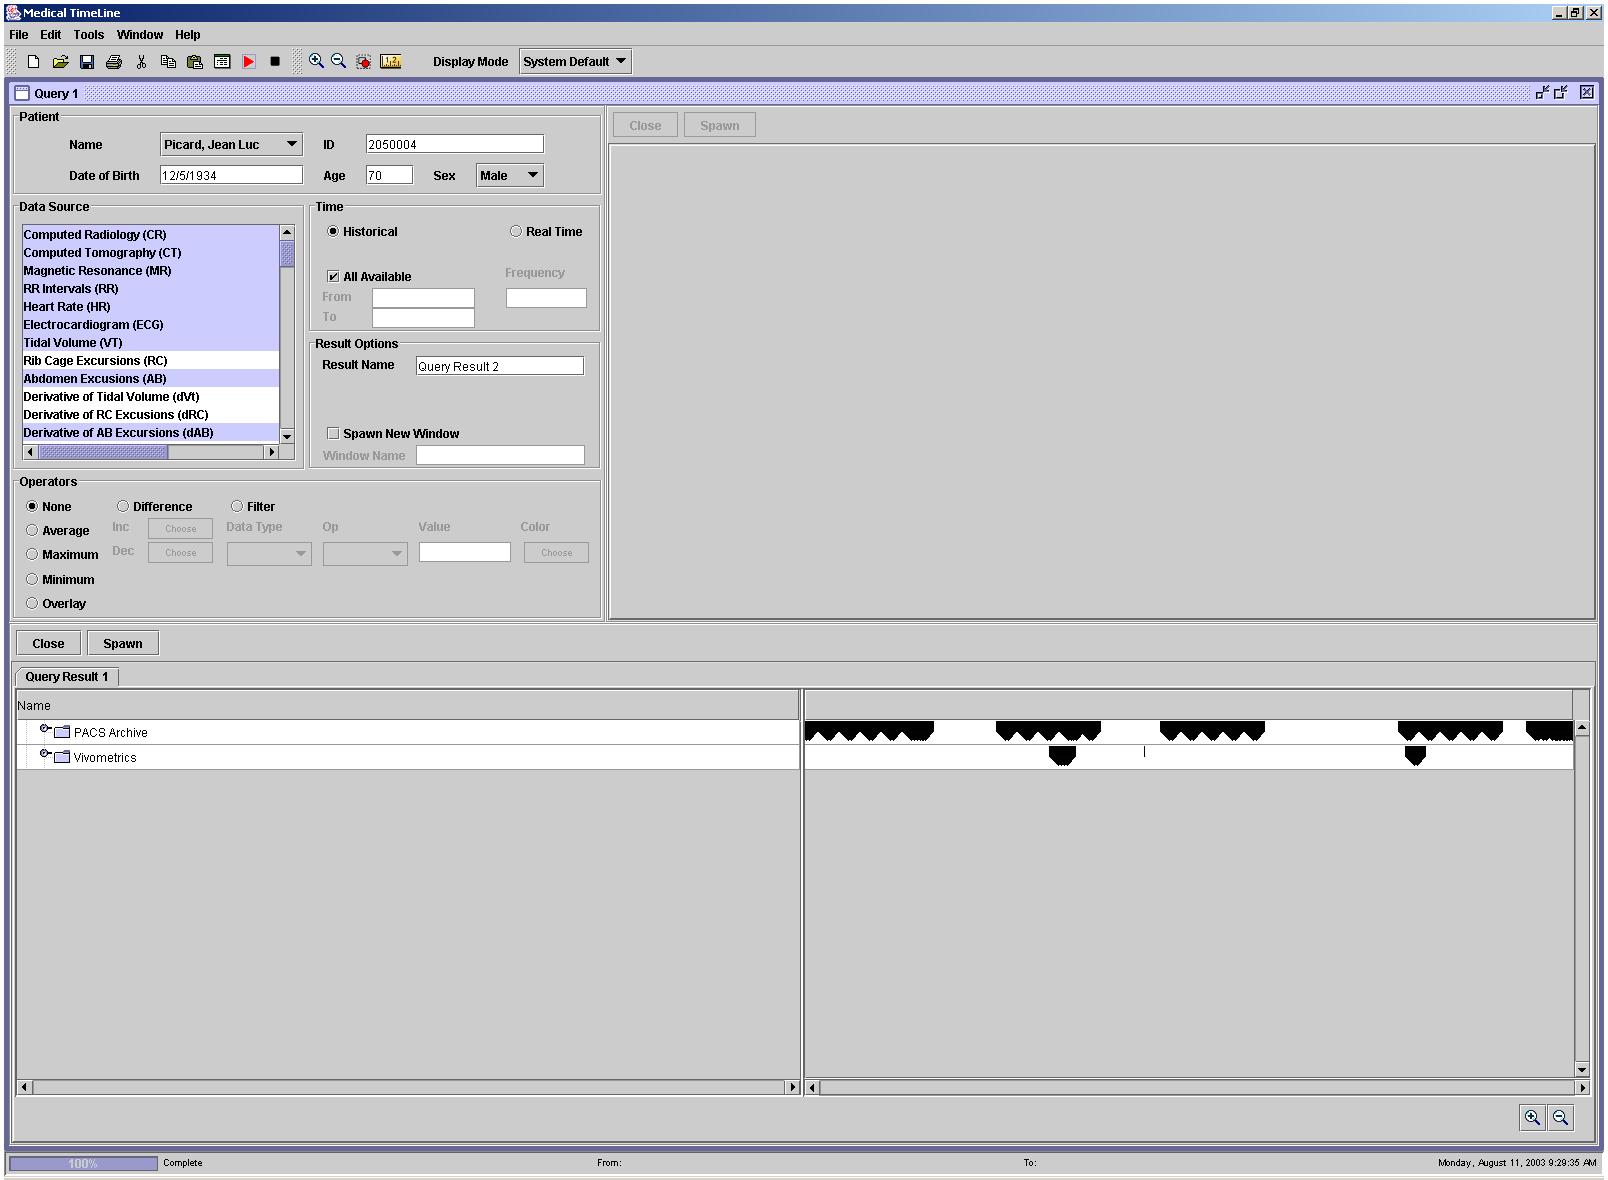
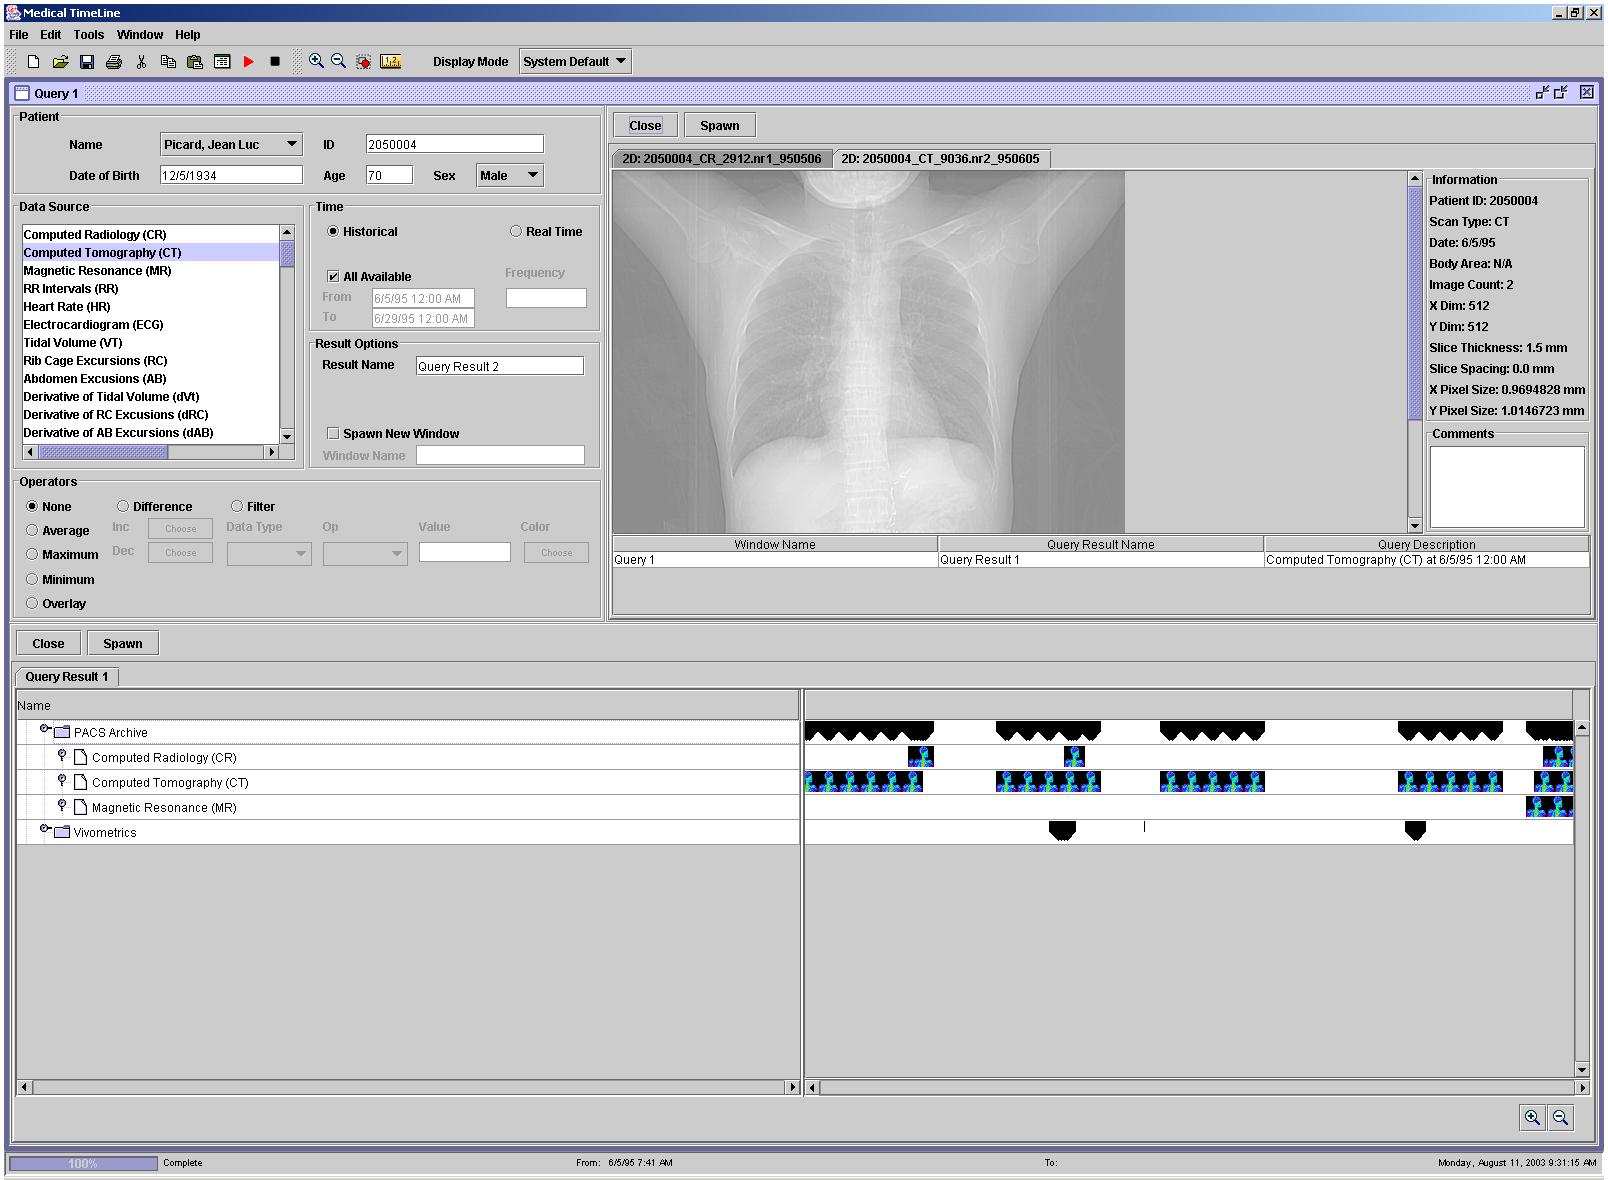
| Display the computed radiology, computed tomography, and magnetic resonance image source streams along with the RR intervals, heart rate, electrocardiogram, tidal volume, abdomen excursions, derivative of AB excursions, median breath by breath differences of end-expiratory lung volume, percent sighs of total breaths every 15 minutes, and median breath rate Vivometric study source streams for patient Jean Luc Picard for all available times. |
| The following data sources for patient Jean Luc Picard for all available times are selected in the menu located at the top left hand corner: CR, CT, MR, RR, ECG, VT, AB, dAB, MqDEEL, pSIGH, MBr/M. |
|
|
|
|
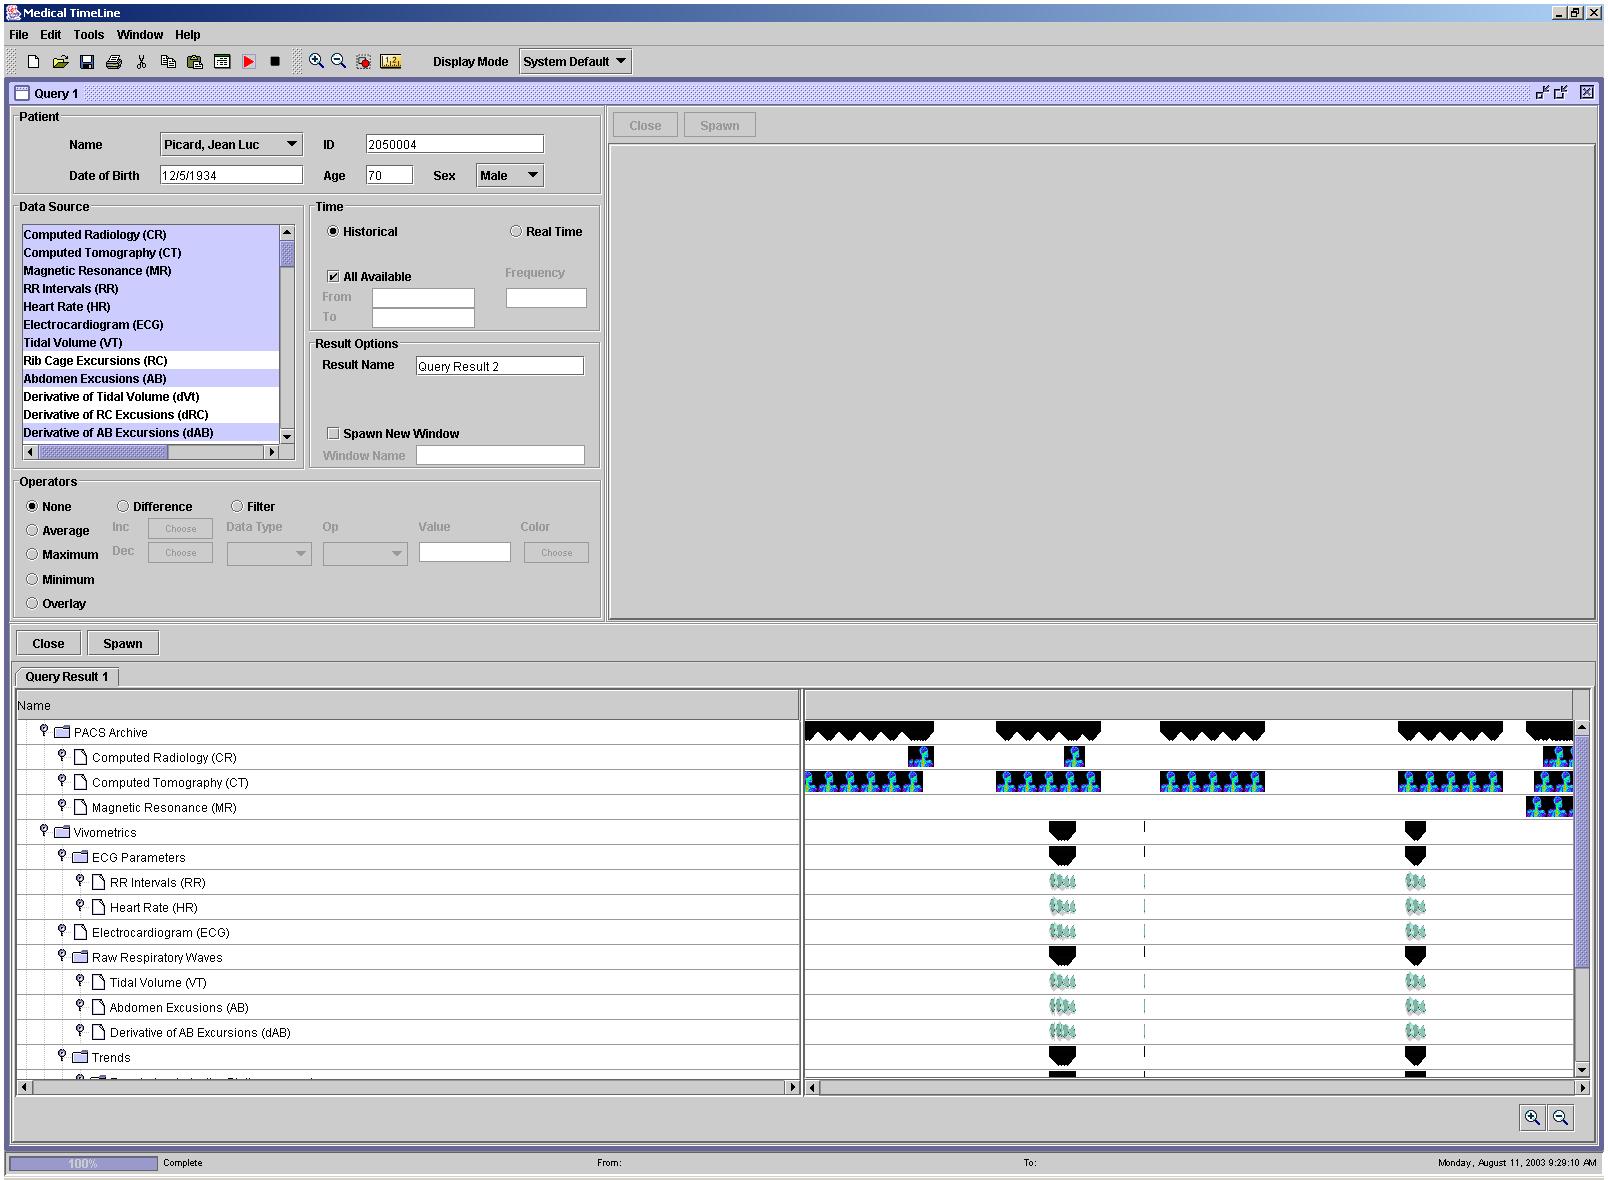
| The bottom panel of the application shows the results for above query in a timeline. Note that the data sources in the timeline are grouped together. |
 |
|
|
| The groupings of data sources in the timeline can be collapsed. The collapses groupings show only the time intervals at which an instance of the data source exists. |
 |
|
|
|
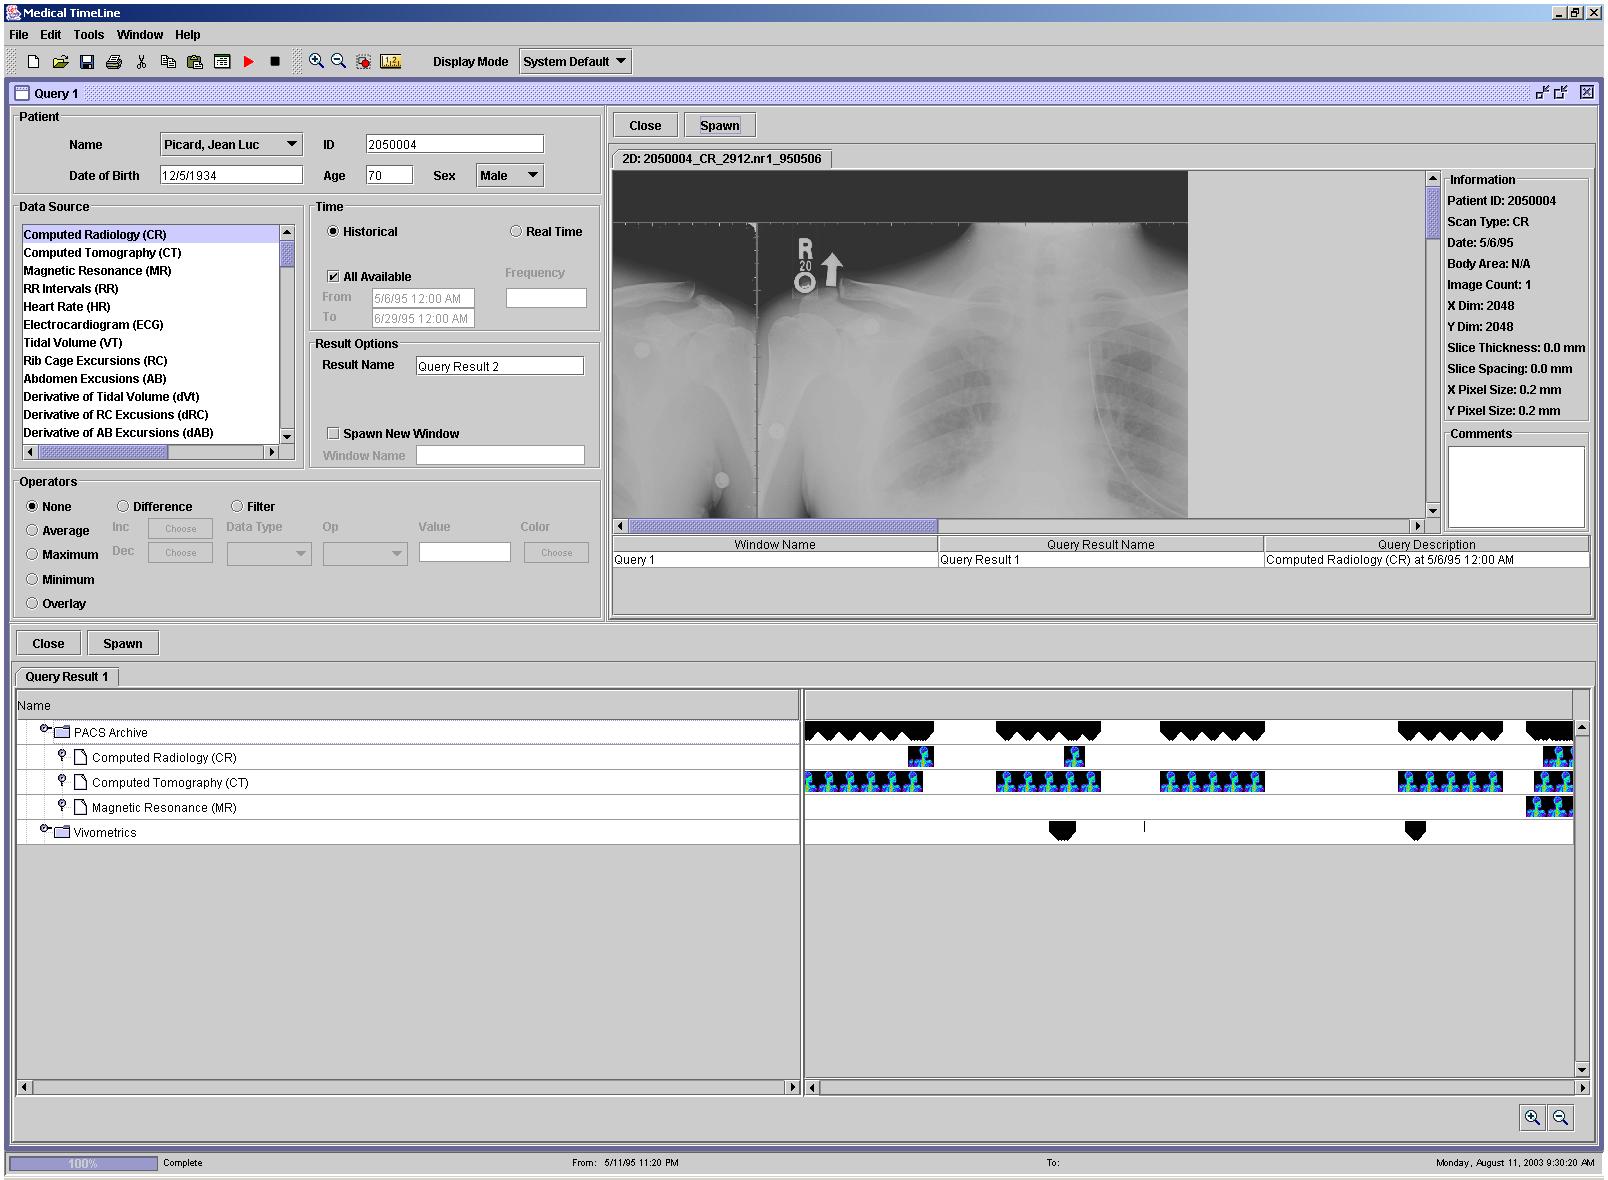
By double-clicking on an image instance on the timeline, an image appears in the visualization window, which is located at the top-right-hand corner of the application. Computed radiology image for patient Jean Luc Picard at 5/6/95 for the chest region is shown. The right-hand-side of the visualization panel shows metadata regarding the image. |
 |
|
|
|
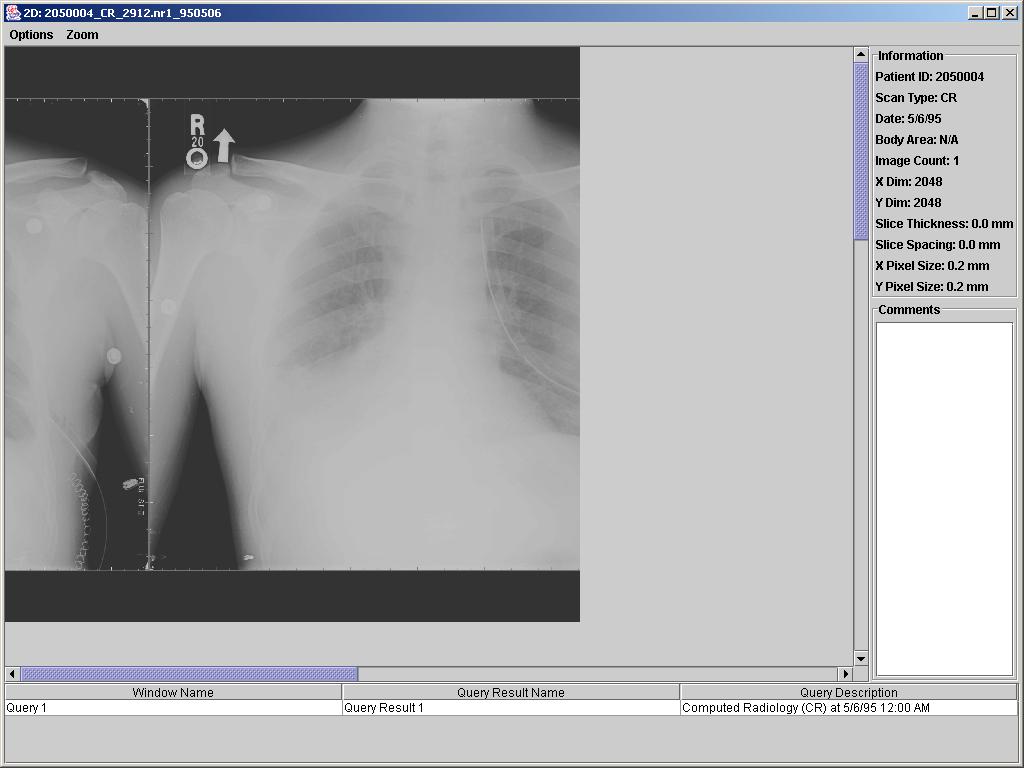
Images on the visualization panel may be spawned off into its own window so that multiple images may be viewed side-by-side. |
 |
|
|
|
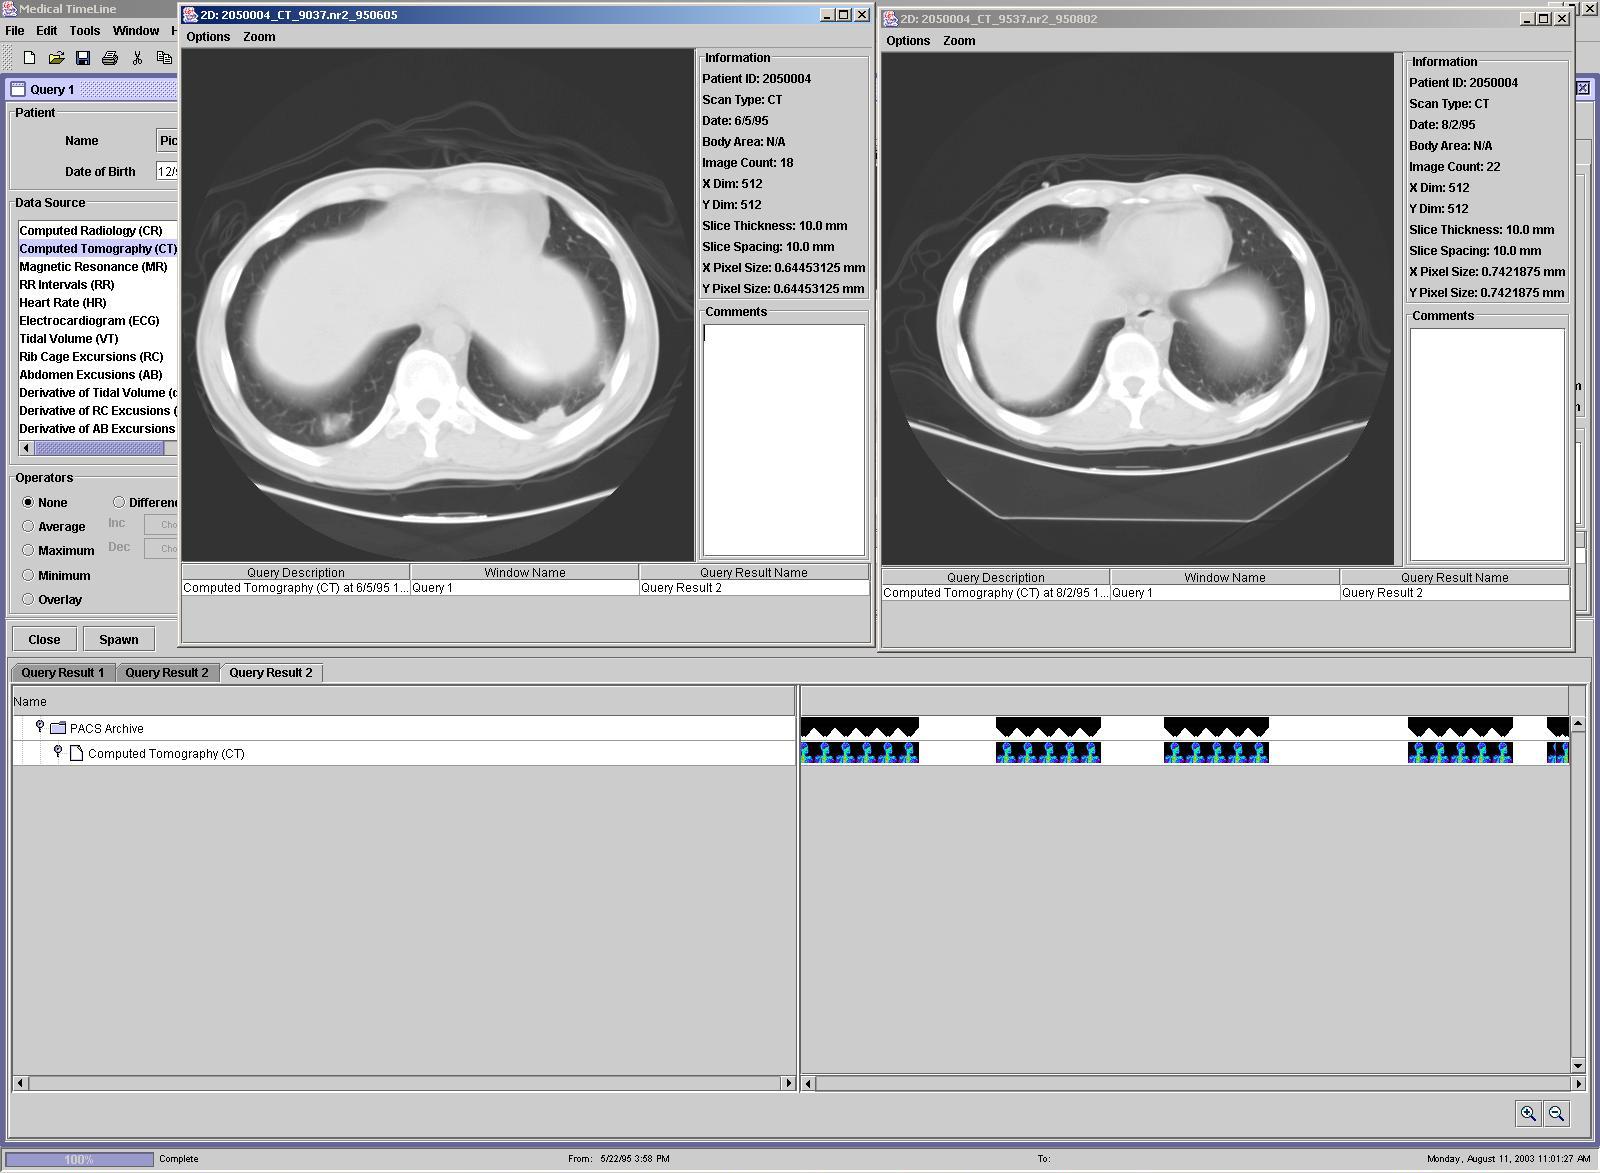
Side-by-side view of CT images at 6/5/95 and 8/2/95. |
 |
|
|
|
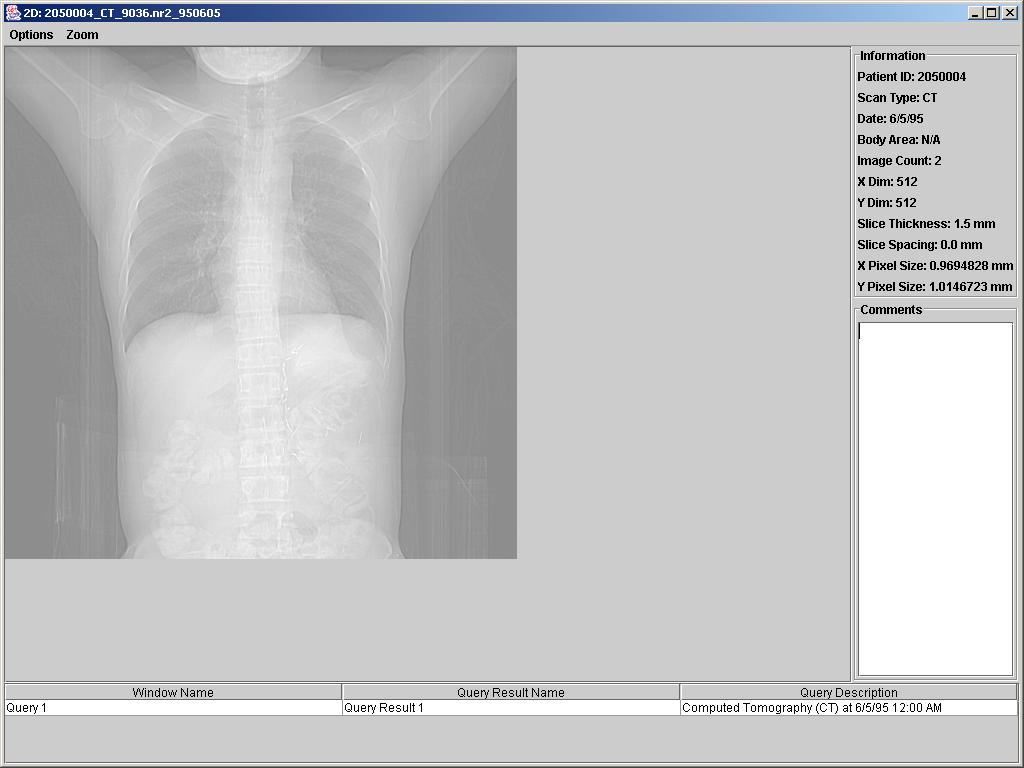
A computed tomography image of the chest area for patient Jean Luc Picard at 6/5/95 that was selected from the timeline. |
 |
|
|
| Like all visualization windows in the TimeLine application, this CT image may also be spawned into a new window. |
 |
|
|
|
| Any opinions, findings, and conclusions or recommendations expressed in this material are those of the author(s) and do not necessarily reflect the views of the National Science Foundation. |